# 绘制人口金字塔图
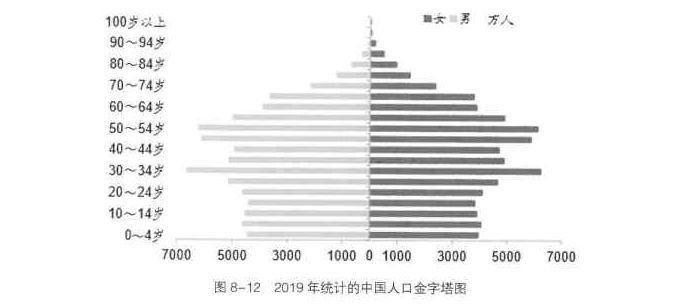
# 人口金字塔图是指用类似古埃及金字塔的形象描述人口年龄与性别分布状况的图形,用于表现人口的现状及其发展类型。人口金字塔图一般以年龄为纵轴、人口数为横轴,按年龄自然顺序自下而上在纵轴左侧和右侧绘制并列的横向矩形条,纵轴左侧为男,右侧为女。例如,2019 年统计的中国人口金字塔图如图 8-12 所示。

# 由图 8-12 可知,人口金字塔图左侧的一组矩形条代表各年龄段男性的人口数,右侧的一组矩形条代表各年龄段女性的人口数。pyplot 可以使用 barh() 函数绘制人口金字塔图。
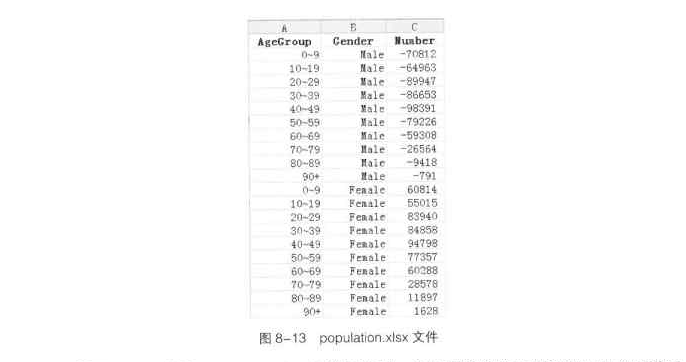
2018 年中国国家统计局对某城市的人口进行抽样调查,并将调查后的结果整理到 population.xlsx 文件中,具体如图 8-13 所示。
需要说明的是,图 8-13 的表格中 Number 一列为男性和女性的人口数,其中男性的数据是一组负数,这是因为代表男性人口数的矩形条位于人口金字塔图中 x 轴坐标原点的左侧。

# 下面使用 pandas 读取 population.xlsx 文件的数据,并根据读取的数据绘制人口金字塔图,示例代码如下。
In [6]:
import numpy as np
import pandas as pd
import matplotlib.pyplot as plt
plt.rcParams['font.sans-serif'] = 'SimHei'
plt.rcParams['axes.unicode_minus'] = False
df = pd.read_excel(r'C:\Users\admin\Dcsktop\population.xlsx')
df_male = df.groupby(by='Gender').get_group ('Male')
list_male = df_male['Number'].values.tolist()       # 将 ndarray 转换为 list
df_female = df.groupby(by='Gender').get_group('Female')
list_female = df_female['Number'].values.tolist()   # 将 ndarray 转换为 list
df_age = df.groupby('AgeGroup').sum()
count = df_age.shape[0]
y = np.arange(1, 11)
labels = []
for i in range(count):
    age = df_age.index[i]
    labels.append(age)
fig = plt.figure()
ax = fig.add_subplot:(111)
# 绘制人口金字塔图
ax.barh(y, list_male, tick_label=lsbels, label='男', color='#6699FF')
ax.barh(y, iist_female, tick_label=labels, label='女', color='#CC6699')
ax.set_ylabel("年龄段 (岁)")
ax.set_xticks([-100000, -75000, -50000, -25000,
               0, 25000, 50000, 75000, 100000])
ax.set_xticklabels(['100000', '75000', '50000', '25000',
                    'O', '25000', '50000', '75000', '100000'])
ax.set_xlabel("人数")
ax.set_title('某城市人口金字塔')
ax.legend()
plt.show()
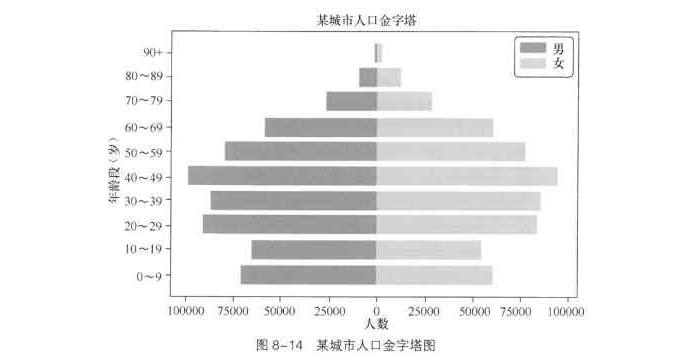
# 运行程序,效果如图 8-14 所示。

